

The most frequent question I got in 2019, (aside from the ubiquitous query if America is going into recession) is if U.S. home prices are in a bubble which will eventually lead to a significant collapse. The short answer is no. One must be careful with the use of that scary word “bubble.” small ebbs and flows in pricing occur regularly and should not be confused with an actual economic bubble formation. I know we have a bubble in everything is in a bubble talk lately, but even that skeptical theory is only done by a few people who literally believe life on the planet is only continuing because of the Fed’s QE in this cycle. So let’s take a look at the housing bubble of the past period and find out if we do have a housing bubble about to pop.
The features of an economic bubble popping, include a 35%-65% minimum decline in prices over a short duration. Eventually, prices return back to their pre-bubble phase.
An excellent historical example of a stock bubble that can be used for comparison is South Sea stock prices in the early 1700s.
Issac Newton:
“I can calculate the movement of stars, but not the madness of men.”

Also, a real bubble is a disconnect from economic fundamentals that needs speculation to push prices higher.
Issac Newton’s investment in the South Sea underwent a massive spike due to speculation and then collapsed in a very aggressive fashion. Now that’s a bubble!
For those anticipating a housing bubble 2.0, I ask you to consider the difference between real home price gains from 2002-2005 vs. 2012-2019 as charted below. We don’t have the rapid adjusted to inflation price gains in this cycle like we did during the housing bubble years of 2002-2005. Since mortgage rates are lower in this cycle than the previous one, demand will be good enough to prevent an epic collapse.
From Doug Short
https://www.advisorperspectives.com/dshort/updates/2019/06/26/s-p-case-shiller-home-price-index-annual-home-price-gains-continue-to-fall


Real home prices are high enough to impact demand when mortgage rates get 4.5% or higher, but we will not lose 1 million to 1.5 million existing home sales in a calendar year from mortgage buyers in this cycle. The peak existing home sales print during the housing bubble was 7,260,000, which crashed down to below 4 million in 2008. We don’t have that booming mortgage demand in this cycle to warrant speculation buying that could lead to a collapse in national home prices anytime soon.
Unlike the housing bubble years, “when anyone with a pulse could get a mortgage,” and, perhaps more significantly, anyone could cash out on their homes as well, in this cycle quality is more important than quantity. This cycle has the best loan profiles I have seen in my 23 years in finance. The majority of homeowners in this cycle can own the debt, and the debt is very vanilla, i.e., no exotic debt structures or old school stated income loans.
This is another reason why mortgage demand isn’t bubble booming, we lend to capacity now. A significant factor to think about is that when the next recession happens, we won’t see the mass scale loan defaults creating distress sale prices like we did in the previous cycle. For sure we will see defaults and foreclosures, but the highest risk owners would be late cycle low down payment homeowners who lost their jobs and don’t have the equity to sell their homes without a short sale. We have created an excellent nested equity position for homeowners who have bought houses from 2010-2016. In short, the scale rate of distress default sales will be low compared to the previous bubble bust.
From Calculated Risk
https://www.calculatedriskblog.com/2019/07/mba-mortgage-applications-decreased.html

From Freddie Mac’s must follow person @lenkiefer
http://lenkiefer.com/


From Doug Short
https://www.advisorperspectives.com/dshort/updates/2019/06/21/existing-home-sales-rebounds-in-may

Real home prices don’t look like a bubble, existing home sales don’t look like a bubble and now let me show you another piece of we aren’t in a bubble housing cycle. Housing Starts have had their weakest economic period ever, and so has new home sales.
From Doug Short:
https://www.advisorperspectives.com/dshort/updates/2019/06/18/secular-trends-in-residential-building-permits-and-housing-starts

In fact, in my recent housing starts article, I showed how housing permits have been stalled for 29 months now.
https://loganmohtashami.com/2019/06/18/housing-permits-stalled-29-months/
New home sales have had a similar chart as above, the weakest new home sales cycle ever recorded in U.S. history even with the longest job expansion, longest economic expansion and mortgage rates really below 5% for the most part since early 2011.
From Doug Short:
https://www.advisorperspectives.com/dshort/updates/2019/06/26/new-home-sales-down-7-8-in-may

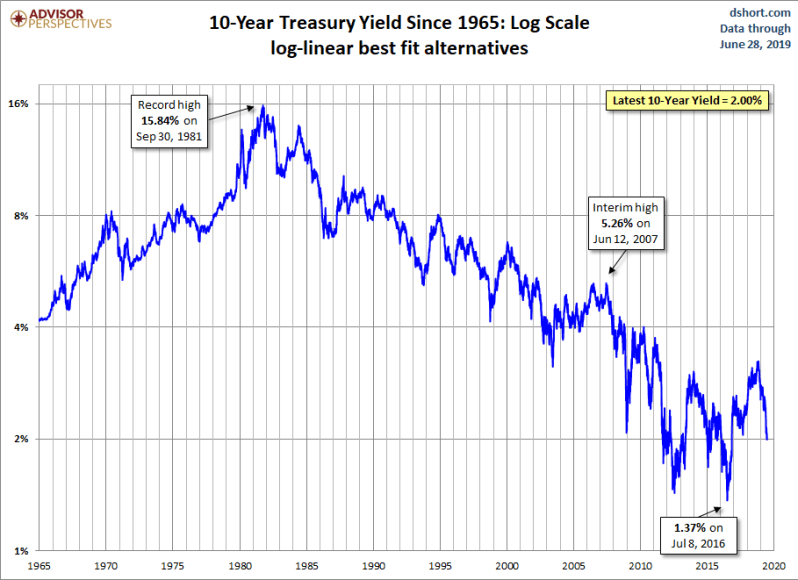
I would really get concerned about housing affordability if mortgage rates got back to 5.875% and this has been my thesis since 2013. For those who have followed my work over the years, they would know since 2014 all my prediction articles have stated that the 10-year yield would stay in the range of 1.60%-3%. This has been the case for the most part outside the Brexit period in 2016 which yields went below 1.60% briefly, and last year we traded quickly over 3% as higher oil prices drove inflation expectations higher than it should have.
Even for 2019, I was forecasting this range and the 10-year yield going to below 2% if world trade got weaker.
“For 2019, I am sticking to my call that the 10-year yield will channel between 1.60% to 3%. If world trade gets weaker, we could see the 10-year yield with a 1% handle again.”
https://loganmohtashami.com/2018/12/29/2019-economic-housing-predictions/
In every housing cycle since 1981, mortgage rates have fallen 2% or more. In this cycle, the low range has been 3.25 to 4.25% For a 2% fall in rates in the next cycle, we would need mortgage rates to be 1.25% – 2.25 %. This would likely mean the 10-year treasury yields would fall below zero. Unlikely much? The trend says we could see negative rates here in America in the next recession.
The best case against negative rates here in the U.S. is that our younger demographic growth will keep a lid on any significant deflationary push downward.
However, as you can see from the chart below, the trend is your friend!
From Doug Short:
https://www.advisorperspectives.com/dshort/updates/2019/07/02/treasury-yields-a-long-term-perspective


As you can see from the data above, we don’t really have any speculation demand going on in housing even with low rates, and the home price gains have happened with some time duration, unlike the real bubble years of the past where it heated up from 2002-2005.
Will home prices come down again, absolutely and noticeably in coastal areas. Will we see national home prices fall like saw in the previous in this cycle, absolutely not when the next recession hits. You can see below how much supply was created during the housing bubble burst, and it would require a lot of distress supply, a lot of demand weakness now.
We also have to factor in that housing tenure has doubled in this cycle as well. Housing tenuring double is a crucial aspect. People are staying in their homes longer and longer the amount of supply coming onto the market during the next recession would be limited to distress sales and the natural supply of homes staying on the market longer. This should prevent the monthly supply spike we saw from 2006-2011 from happening again during the next recession, which would make calling this cycle housing bubble 2.0 not a valid theory. Remember, the homeowners in this cycle from 2010-2019 look about the exact opposite of the homeowners we saw from 2002-2005.
From the NAR:


You have seen a model on what a housing bubble looks like. We need to see real massive price gains in a short time, speculation demand, total demand growth, and vast production of homes because people believe we simply have no homes to buy ( wink wink). Can we have another bubble in housing, of course, but hopefully what I showed above gives you an idea of what to look for and why this cycle doesn’t look like the previous one.
Last thing!
Typically you don’t see a bubble in the very same sector back to back, remember that the next time people say housing bubble 2.0. Also, we are running into a better demographic patch for housing in the next decade, (Ages 25-31 are the biggest in America today) which means we have decent replacement buyers coming into the next decade.
Logan Mohtashami is a financial writer and blogger covering the U.S. economy with a specialization in the housing market. Logan Mohtashami is a senior loan officer at AMC Lending Group, which has been providing mortgage services for California residents since 1987. Logan also tracks all economic data daily on his own facebook page https://www.facebook.com/Logan.Mohtashami