

Mortgage Purchase Applications
Last year (2014) we had double-digit declines in mortgage purchase applications year over year, even with falling interest rates . So far this year, as we are in month three, demand has been flat, year over year, to slightly higher, but it is not meeting my expectations of 5-10% growth, which would still be quite modest since we are comparing it to a 21st century low set in 2014. Interest rates are lower this year as the 10 year yield got near to my predicted 1.60% level with a 1.64% print in 2015. The low rates however, haven’t created increased mortgage demand.
Mortgage Purchase Applications and Mortgage Rates Declines Since 2007 (credit Professor Anthony Sanders)
https://confoundedinterest.wordpress.com/

Today’s mortgage purchase applications number showed 3% year over year growth, which is a start. But better than 3% growth is needed to improve the market from the 21st century low set in 2014. There are still a few more months in the spring selling season to make up for our slow start in 2015 but by June the season will be over and mortgage purchase applications will start their traditional seasonal decline in volume.
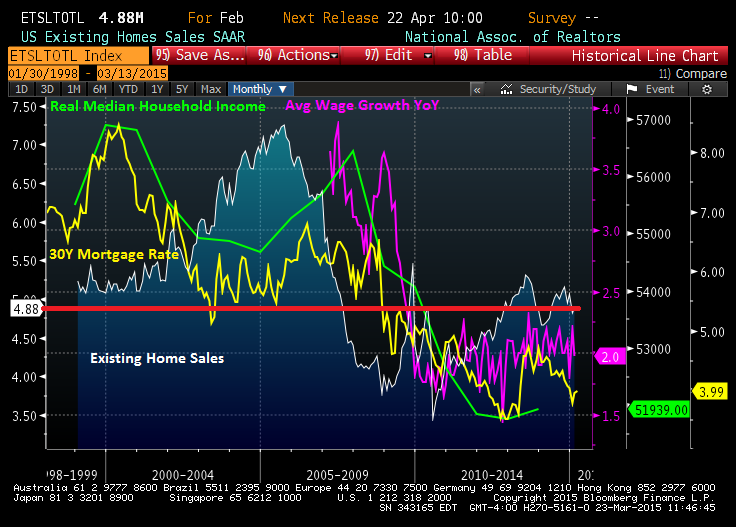
Existing Home Sales
Existing home sales, so far this year, are showing year over year growth but since last year sales were so soft, this is not necessarily evidence of a healthy market in this sector. Cash buyers are under 30% for the first two months of this year, whereas in January and February of 2014 they were 33% and 35% percent of the market, respectively. Cash buyers have been holding up the housing market with their “over-participation”. Now that we are seeing fewer cash buyers mortgage buyers will need to pick up the slack in order to have growth in this segment. I predict a slight year over year gain for total existing home sales as long as cash buyers stay in the market with their current participation rate. We have just started the spring selling season so we will need to see a strong uptick in the Seasonally Annual Adjusted Rate of Sales (SAARS) in order to achieve over 5.4 million peak sale for the year.
First Time Home Buyers
We’ve heard a lot of hype about first time home buyers making a comeback in 2015 to pick up this slack and drive overall growth in the market. But the painful truth is that first time buyers are still below 30% of the market (last year they were 29% of the market) whereas in a healthy market we would expect them to make up about 40% of the market. Household formation numbers are improving which is the first step in the social cascade that leads to home purchase. Rent , date, mate, marry, 3.5 – 6 years after marriage home purchase, is the social sequence we need to improve this segment.
Our biggest age group in America is the 23 -25 demographic. They will need some time to mature into first time purchasers.
New Home Sales
After a huge miss in sale expectations in 2014, new home sales are showing growth in the first two month of the year. The numbers reported are confounded with large margins of error but do show upward momentum. I expect total growth of 8%-12%, year over year, for this sector, but keep in mind this makes up only about 10% of total home sales. Builders could potentially generate more sales if they were willing to incentivize the middle-income buyer instead of focusing only on the wealthy buyer. We saw some growth in 150K -$299K price range, but a large percentage of sales still, are in the over $400K range.

So what can we look for in the Spring of 2015 for housing? Mortgage purchase applications are flat to slighter higher, existing home sales look to be slightly higher for the total year number. New home sales are showing double-digit growth but are still tilted toward the upper income home level and make up only a small part of the overall market.
These metrics are no surprise to me because my core thesis since 2010 has been that we don’t have enough qualified home buyers in America (once you remove the wealthy cash buyers) to drive a normal healthy market.
Added proof of this is that the Federal Reserve’s emergency interest rate policy of zero percent is still in place seven years into this economic cycle. The 10 year note is below 2%, a low which hasn’t been seen since 1941-1945.. These facts demonstrate that the Fed does not believe we have fully recovered no matter what they verbalize to the market place. In fact mortgage rates have been below 5% since early 2011 and so has the zero interest rate policy but this has not driven strong mortgage demand from Main Street.

Logan Mohtashami is a senior loan officer at AMC Lending Group, which has been providing mortgage services for California residents since 1988. Logan is also a financial contributor for Benzinga.com
Thanks Logan. You always are able to cut through the fluff and share what is really happening by using actual data.
Something else I find interesting, there currently seems to be a lack of pre-existing home inventory (at least in our market). March brought hardly anything new to market here. Normally a lower supply would equate to a “seller’s market” but it appears a trend is starting to show that homes are staying on market longer along with selling price dropping further from original listing price. I walked through two immaculate, very nice homes in great neighborhoods this past weekend which have both been listed for well over 4 months (in fact one started listing last August). Both have come down considerably from their original asking price and neither have had even 1 offer yet. I’ve seen this with many other homes in our area as well. I’m thinking this could be a sign we’ve either hit an affordability ceiling or, like you’ve been saying for years, there’s just not very many qualified homebuyers out there right now.
Here is one dynamic that I wish the housing pundits on the national media would talk about more
We had a debt leverage bubble in the housing cycle which means that we couldn’t even get a property inventory market for at least 8-12 years from the crash. Myself I was looking at this happening in 8 or 9 year but it’s taking a bit longer than I thought
We had less inventory on the market as an annual basis on months inventory for a year in years
1999
2000
2001
2002
2003 – bubble years
2004- bubble years
2005 – bubble years
Then, we had an excess supply rush due to the bubble starting to pop
2006-2011 all above 6 months inventory
Now, with how long it took to get distress sales onto the market and the massive price gains we have seen from 2012-2015. The normal inventory curve won’t look the same because 45% if all homes bought in this cycle were done by the Rich and a lot are looking for yield return so it’s staying put
Those who have a reason to sell or want sell can. However, if you’re selling to move up then adjusting to the affordability index you need about 28%-33% equity to sell and put 20% down to move up without any cash injected into the equation
So, inventory coming on to the market will be spotty in this cycle, not normal at all.
Also, some people are sitting on a home with a long term rate at 3.25%-4.25% that home is a nice financial asset long term if you want to rent it out.
We are no longer in a housing cycle where rates drop 2% ever few years, that cycle has ran it’s limit