

In 2017, I wrote:
“For 2018, I anticipate existing home sales to be in the range of 5.27 – 5.53 million units. If we end the year showing negative growth, with rising inventory once again, don’t worry, be happy. This would be “normal” especially when purchase applications are still trying to party like it is 1999.”
https://loganmohtashami.com/2017/12/31/2018-economic-housing-predictions/
Before I discuss today’s existing home sales report, I’d like to address a few points.
1. Housing economics are exactly as I predicted for this point in the cycle. The housing industry is plagued with uber-bulls and dreaded-bears with only a few, it seems playing the middle game. My forecast for this year of flat to negative sales, was exactly the same forecast I had 2017, except I warned of a year over year increase in inventory without an increase in sales. This prediction took a direct shot at those in our industry who said last year that home sales would be higher if we had more supply. Last November existing home sales hit a cycle high when inventory was at a cycle low. Twice now in this economic expansion we have had negative year over year sales during periods that inventory rose. 2019 could be the third year in this expansion when higher inventory didn’t result in higher sales but did facilitate negative year over year growth.
Be wary of those, such as the esteemed Lawrence Yun, that say seasonal factors are leading to weakness in sales.
“NAR Chief Economist, Lawrence Yun, says there is a clear shift in the market with another month of rising inventory on a year over year basis, though seasonal factors are leading to a third straight month of declining inventory. #NAREHS “
As I previously said: “This isn’t an accurate statement, sales hit cycle highs on a few occasions during non seasonal buying times in this cycle.”
This happened toward the end of 2016, the start of the 2017 and November of 2017. All of these higher existing home sales print didn’t come during the spring selling season.
From Doug Short:
https://www.advisorperspectives.com/dshort/updates/2018/10/19/existing-home-sales-decline-in-september-lowest-in-almost-3-years

2. Mortgage rates of 4.5% plus does not kill the housing market but it does slow the rate of growth. Other factors, like housing tenure, may be more important to sales growth than interest rates. Housing tenure has been rising for a decade while interest rates have been falling from the previous cycle.
3. Even though you may have heard the doom and gloom predictions that housing sales are slowing and fed rate hikes will end our economic prosperity, unless you like being miserable for no reason, relax. Housing starts are up year to date, new home sales are still beating my estimates for the year and purchase applications are up year over year every single week outside of 3 weeks this year. Everything is fine. In fact 2018 looks nothing like 2014 where purchase application data was down on trend -20% year over year.
From Calculated Risk:
https://www.calculatedriskblog.com/2018/10/mba-mortgage-applications-decreased-in_17.html

December 31st 2017
“If we end the year showing negative growth, with rising inventory once again, don’t worry, be happy. This would be “normal” especially when purchase applications are still trying to party like it is 1999.”
The report released today on existing home sales states the following:
NAR:
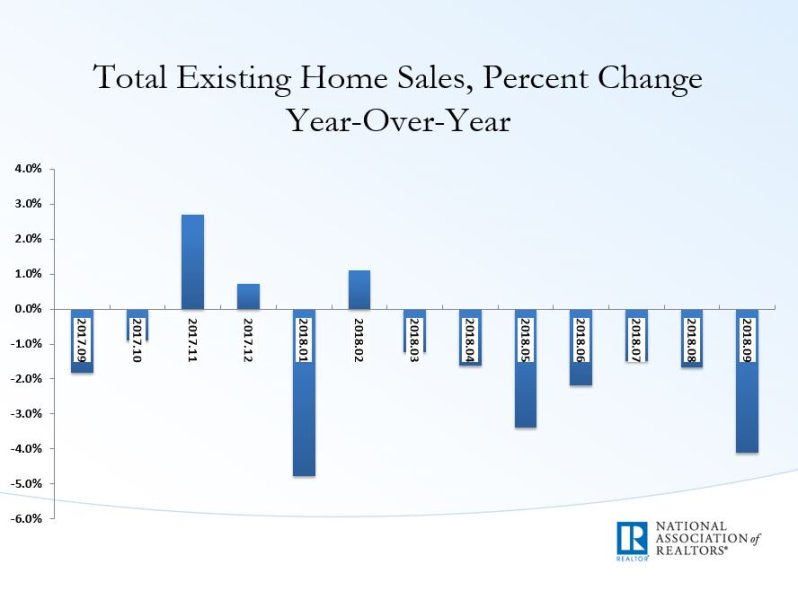
Existing-home sales declined in September after a month of stagnation in August, according to the National Association of Realtors®. All four major regions saw no gain in sales activity last month.
Total existing-home sales1, https://www.nar.realtor/existing-home-sales, which are completed transactions that include single-family homes, townhomes, condominiums and co-ops, fell 3.4 percent from August to a seasonally adjusted rate of 5.15 million in September. Sales are now down 4.1 percent from a year ago (5.37 million in September 2017).
This is the first real noticeable weaker print for the year. I expected the lowest seasonally adjusted annual rate (SAAR) of sales to be in the area of 5,270,000. However, the trend of sales down, inventory up” is perfectly in line with my expectations for the year. For 2017, my lowest sales print prediction was actually 5.15 million, so I am not totally shocked to see this number today.
Sales are now down 4.1% from a year ago (5.37 million in September 2017). #NAREHS
Cash buyers still holding up well, running double the historical percentage of sales. If investors no longer feel that they can achieve a reasonable rate of return and abandon residential real estate then we will need, at minimum, double-digit growth in mortgage purchase applications every week to grow sales next year.
First-time buyers were responsible for 32% of sales in September; Individual investors purchased 13 percent of homes in September; All-cash sales accounted for 21% of transactions; Distressed sales were 3% of sales in September. #NAREHS

Last year we had lower inventory and rising sales. This year, not so much. However, there is no escalation in the year over year inventory increases, so please ignore those who are predicting a 30%-40% fall in home prices. It’s not happening. Housing inventory is a complicated issue that has never been respectably addressed by the media or analysts. In 2014, purchase application data was negative -20% year over year and inventory rose to 5.8 months for one month of the year, sales went negative year over year and prices still rose.
Unsold inventory is at a 4.4-month supply at the current sales pace, up from 4.3 last month and 4.2 months a year ago. #NAREHS

The housing data published in today’s report are consistent with my expectations for sales in 2018. The print was softer than my lowest prediction for SAARS but 2018 total sales are right in line with my expectations. Watch for the November report released in December to continue to show probably the weakest year over year growth of the year. Demand from mortgage buyers during the years 2008 to 2019, has been slow and steady, with record-breaking demand from cash buyers. Growth in the U.S. housing market hinges on increasing the number of mortgage buyers while cash buyers fall. A major determinate for the future of U.S. housing economics will be if housing tenure falls or stalls when birth rates grow in years 2020-2024.
One final note for those in Southern California: I will be part of a housing panel on November 8th in Mission Viejo to talk about the state of housing and what to look for in 2019.

Logan Mohtashami is a financial writer and blogger covering the U.S. economy with a specialization in the housing market. Logan Mohtashami is a senior loan officer at AMC Lending Group, which has been providing mortgage services for California residents since 1987. Logan also tracks all economic data daily on his own facebook page https://www.facebook.com/Logan.Mohtashami
Hi Logan, hope you’re doing great!
Because your predictions are usually right, can you tell me how far U.S. home prices will fall after they eventually peak out.
Thank you
Robert Campbell