

Today new home sales came out, and we can clearly see the profound impact of Covid19 here.
2020 BC (Before Coronavirus) data best in the cycle
New home sales data average 759,000 2-month average, best in the cycle.
Monthly Supply-Average 2 months in 2020 5.1 months.
Today we saw sales fall back down to 627,000 and monthly supply back up to 6.4 months.
The most crucial housing chart we have in America looked great early on in 2020, and you can see why we had near 40% year over year growth in housing starts in February. However, that has changed. Even though we aren’t back to the December 2018 highs of 7.4 months in monthly supply, this chart shows you why housing starts won’t be growing as long as supply is rising.
From Fred:
https://fred.stlouisfed.org/series/MSACSR

On twitter this year, when $TOL broke under $17, that was time for me to get in again.
https://stockcharts.com/h-sc/ui?s=TOL

From Census:
https://www.census.gov/construction/nrs/pdf/newressales.pdf
New Home Sales
Sales of new single‐family houses in March 2020 were at a seasonally adjusted annual rate of 627,000, according to estimates released jointly today by the U.S. Census Bureau and the Department of Housing and Urban Development. This is 15.4 percent (±14.8 percent) below the revised February rate of 741,000 and is 9.5 percent (±14.6 percent)*
below the March 2019 estimate of 693,000.
Sales Price
The median sales price of new houses sold in March 2020 was $321,400. The average sales price was $375,300.
For Sale Inventory and Months’ Supply
The seasonally‐adjusted estimate of new houses for sale at the end of March was 333,000. This represents a supply of 6.4 months at the current sales rate.
From Doug Short:
https://www.advisorperspectives.com/dshort/updates/2020/04/23/new-home-sales-down-15-4-in-march

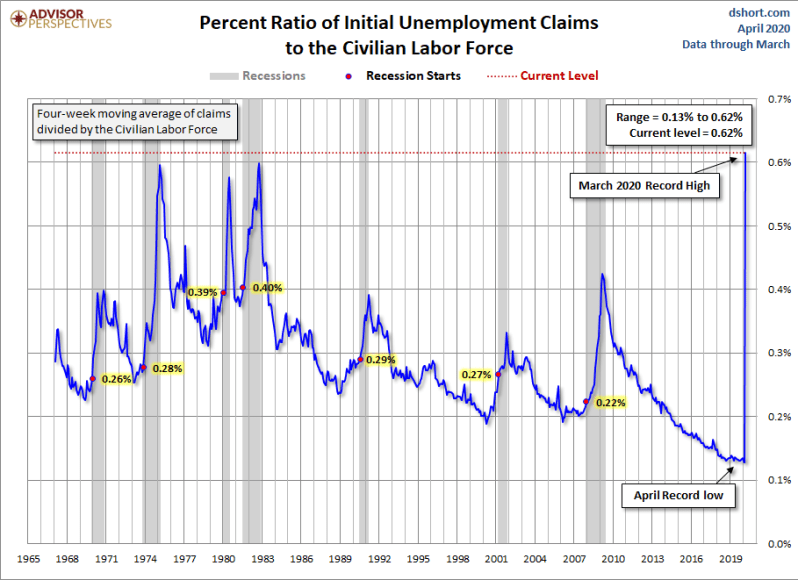
Jobless claims, which are a Covid19 nightmare chart, just get worse. Even though the rate of growth of jobless claims rising is coming down, we have roughly 26.5 million Americans out of work. It took 10 years to create 22.5 million jobs, and in 5 weeks we lost 26.5 million. This data line was positive on March 12th, 2020, and near all-time lows. The speed and velocity of shutdown protocols have created the worst looking economic charts of our lifetime historically.
From Doug Short:
https://www.advisorperspectives.com/dshort/updates/2020/04/23/weekly-unemployment-claims-4-43m-down-810k-from-last-week


Logan Mohtashami is a financial writer and blogger covering the U.S. economy with a specialization in the housing market. Logan Mohtashami is a senior loan officer at AMC Lending Group, which has been providing mortgage services for California residents since 1987. Logan also tracks all economic data daily on his Facebook page https://www.facebook.com/Logan.Mohtashami and is a contributor for HousingWire.