

First and foremost, we are still in the AD (After the Disease) stage of the cycle. The continuing of the waterfall and parabolic charts in a lousy way continues today with the economic data.
Retail Sales: https://www.census.gov/retail/marts/www/marts_current.pdf
Advance estimates of U.S. retail and food services sales for April 2020, adjusted for seasonal variation and holiday and trading-day differences, but not for price changes, were $403.9 billion, a decrease of 16.4 percent (± 0.5 percent) from the previous month, and 21.6 percent (± 0.7 percent) below April 2019. Total sales for the February 2020 through April 2020 period were down 7.7 percent (± 0.5 percent) from the same period a year ago. The February 2020 to March 2020 percent change was revised from down 8.4 percent (± 0.4 percent) to down 8.3 percent (± 0.3 percent). Retail trade sales were down 15.1 percent (± 0.4 percent) from March 2020, and 17.8 percent (± 0.7 percent) below last year. Clothing and clothing accessories stores were down 89.3 percent (± 1.8 percent)from April 2019, while nonstore retailers were up 21.6 percent (± 1.4 percent) from last year.
Like most economic data, retail sales were trending positive early in 2020, but that was all BC (Before Coronavirsu) action. These waterfall charts are historical, but they do set the groundwork for a bottom as well.
From Doug Short:
https://www.advisorperspectives.com/dshort/updates/2020/05/15/retail-sales-down-16-5-in-april


Job openings, which lags a few months, shows its first real AD data line as we were working from roughly 7,000,000 job openings and 24 straight months of more openings than unemployed workers before the virus hit. Next’s month data will capture full COVID darkness. As we can see below, a parabolic chart on layoffs and discharges.
BLS: https://www.bls.gov/news.release/pdf/jolts.pdf
The number of total separations increased by 8.9 million to a series high of 14.5 million in March, theU.S. Bureau of Labor Statistics reported today. Within separations, the quits rate fell to 1.8 percent, and the layoffs and discharges rate increased to 7.5 percent. Job openings decreased to 6.2 million on the last business day of March. Over the month, hires declined to 5.2 million. The changes in these measures reflect the effects of the coronavirus (COVID-19) pandemic and efforts to contain it. This release includes estimates of the number and rate of job openings, hires, and separations for the total nonfarm sector, by industry, and by four geographic regions.
From Doug Short:
https://www.advisorperspectives.com/dshort/updates/2020/05/15/job-openings-labor-turnover-march-2020-update

Now, moving ahead. Taking a look back at what I need to see to get to the AB (America is Back) stage from the article I wrote for HousingWire on April 7, 2020.
5 indicators that will show when the housing market is rebounding from COVID-19
So far, only 2 items of real progress I can report:
1. Flattened Curve
“It is from this data that I have based my virus turnaround thesis, which is that by May 18 or sooner, we will see a flattening of the new infection curve, and by September 1, we will be at a much higher capacity to fight this virus.”
We are a few days from May 18, and we have progressed for sure, but we always need to be extremely vigilant around this virus. We have to make sure that our hospitals don’t get overloaded with cases if we reopen the economy in scale.

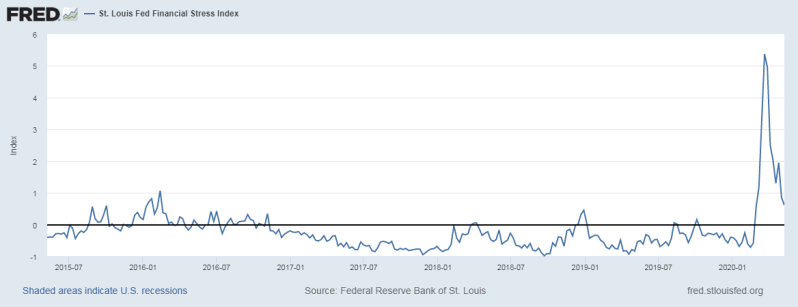
4. A decline in Credit Stress
The St. Louis Financial Stress Index has come down a lot recently and is currently standing at 0.6123%. Below zero with duration is what we want to strive for. However, we got below the first critical level of 1.21%
From Fred: https://fred.stlouisfed.org/series/STLFSI2


Some of the data, such as driving, hotel occupancy, TSA checkpoints, Open table, are bouncing from the mother of low bars. We see some areas of the U.S. reopen. However, we aren’t there to talk about these data lines or events just yet. Also, Jobless claims still look terrible.
From Doug Short:
https://www.advisorperspectives.com/dshort/updates/2020/05/14/weekly-unemployment-claims-2-98m-down-195k-from-last-week

We have a lot of work to do as a country, and a lot of crazy variables left for the remainder of the year. I can’t believe I am saying this, but we might get trade war tap dance headlines again during the virus pandemic, so that is in play.
Once we defeat this virus, we can’t let up on making sure we get back to January & February economic data, which was good in the 2020 BC era. If you want to track economic data weekly, I suggest the WEI.
Fred: WEI https://fred.stlouisfed.org/series/WEI


Have a safe weekend my friends.
Logan Mohtashami is a financial writer and blogger covering the U.S. economy with a specialization in the housing market. Logan Mohtashami is a senior loan officer at AMC Lending Group, which has been providing mortgage services for California residents since 1987. Logan also tracks all economic data daily on his Facebook page https://www.facebook.com/Logan.Mohtashami and is a contributor for HousingWire.