

Overview of 2016
2016 started with the worst stock market performance ever, falling oil prices, dropping bond yields and cheers from the American bears anticipating their long-hoped-for recession. But with the closed of 2016, we see that our American bears are grievously disappointed once again; their doomsday expectations not realized. Instead, the U.S. is enjoying job openings at an all-time high, a 43 year low in unemployment claims, and slow and steady growth in the housing industry.
The rise in the U.S. dollar did impact manufacturing which has been struggling but oil prices rose and rig counts, an indicator of stronger oil prices started to grow again slowly.
Housing inventory levels didn’t dampen home sales as both existing and new home sales hit cycle highs. Home prices, too, continued to grow. A downtrend in multifamily construction affected housing starts but losses in this sector were partially made up for with growth in starts for single-family residences, suggesting expectations for more home buyers and fewer renters.
The 10-year yield defied those who said rates would go only up by hitting a cycle low due to Brexit.
Despite the rocky start, 2016 was a decent year in terms of U.S. economics, but there are changes in the wind as we blindly lurch forward into 2017.
The first unknown we must face in 2017 is the big elephant in the room, pun intended. I am not one who believes that Presidents and their policies are strong influencers of economic cycles. Generally speaking, a U.S. president doesn’t have the singular power to change a behemoth economy like that of the U.S. He or she would need to enlist a concerted effort on the part of Congress and the Fed in order to have much effect. Even with that, the first year of the administration isn’t enough time to really make an impact. Demographics, inflation and over-investment in key sectors are the variables that can change an economic cycle.
Predictions for 2017
1. Mortgage Rates and the 10 Year Yield
For the past few years, I have stayed true to my channel call for the bond market ten-year yield to be between 1.60 -3%. My prediction article for last year included a statement that the 10-year would have a 1 handle again even with a fed rate hike.
https://loganmohtashami.com/2015/12/28/2016-housing-economic-predictions/
The only thing that has changed in this cycle is that inflation expectations are picking up. I predict that headline year-over-year inflation numbers will look stronger in 2017 due to the pick up in oil prices. The 10-year yield has twice moved from the 1.60% to 2.50%-3%, once in 2013 and again in 2015. Also in two occasions in this economic cycle, an economic event in Europe resulted in a drop in the yield to under 1.60%. The Spanish default fear trade in 2012 drove yields to the 1.36% level and Brexit resulted in a new low for 2016 of 1.31% . For 2017, I am sticking to my call that the 10-year yield will channel between 1.60% to 3%. Yes, I do expect to see a 1% handle again. You may get a short term breach of over 3% if a headline risk drives algorithm selling in the bond market – but again,if it occurs it will be short lived. Mortgages rates again stick in the 3.5% – 4.5% range for most of the year and anything above 4.5% or a 10 year above 3% should be short-lived.
Inflation is low and there are trillions of bond yields still at negative rates so the U.S. market can’t deviate too much from those levels. If world trade really picks up, you may see the 10-year yield rise higher, however, the strong dollar will keep this in check. Because CPI and PCE inflation is higher than they were in the early part of 2015, one can make a case that the 10-year yield should be higher, but global yields are keeping this in check. We cannot deviate too much from these global yields as Germany and Japan still have negative yields. Therefore, I will stick with my channel of 1.60- 3%, with headline risk breaking from those ranges, short-term.
From Fred:
https://fred.stlouisfed.org/series/DGS10

2. Home Prices
Home prices still have legs to go higher in 2017. This is due more to supply than demand. This cycle has demonstrated that you don’t need a strong demand for home prices to rise. Millions of people buy homes every year and this cycle has had the weakest demand with the lowest interest rates ever. But home prices continue to rise due to low inventory. For many years I have been stressing that the U.S.housing market doesn’t “naturally” support 6 months of inventory. This has been true of the market since the post- 1996 outside the housing bust years of 2006-2011. With this in mind, home prices should continue to rise until a job loss recession. I predict the growth of 1%-4% in home prices for 2017.
Remember, inventory fell in 2016 and home sales still hit a cycle high. Higher home prices did not bring more inventory into the market, a lot of owners still did not have enough equity to move up. We also have millions of rental housing and booming rental demand still keeping those homes in a rental status. Don’t look for inventory to move too much either way because housing affordability issues are keeping both would-be buyers and sellers where they are. The tenure of living in the same home hit another all-time high in 2016.
From Calculated Risk:
http://www.calculatedriskblog.com/2016/12/real-prices-and-price-to-rent-ratio-in.html

3. Existing Home Sales
For 2016, the high-end of my sales target for existing homes was 5.43 million. We are roughly at that exact level for total existing home sales for 2016 with one more report left. We saw growth in mortgage demand and a decline in the number of cash buyers. This trend is positive for future existing home sales. Even though total growth wasn’t strong in 2016, the internal data for demand in this sector was the best in cycle. We saw a growing number of mortgage buyers along with a falling number of cash buyers, in a year that saw total growth in sales. Mortgage rates are higher and we have had another year of price gains. Therefore, I expect 2017 to look much like 2016 in terms of existing home sales. We will eventually see a push in demand driven by changes in demographics but that is still a few years away. For 2017, I predict existing home sales to come in around 5.15 to 5.45 million. Even if 2017 finishes with negative growth, this will not be caused to worry. Our path is slow until demographics get better.
From Doug Short:
https://www.advisorperspectives.com/dshort/updates/2016/12/21/existing-home-sales-continue-to-climb

4. New Home Sales
For me, new home sales are the most interesting economic sector for 2017. For 2016, I predicted the growth of 4%-8% unless the median price fell or goes nowhere to stimulate even better growth. The median new home price hasn’t done much in the last two years, indicating that builders were offering some smaller, more affordable home – a bullish trend.
From Fred:
https://fred.stlouisfed.org/graph/?g=ccKF&utm

However, higher mortgage rates do impact new home sales as this sector is heavily reliant on mortgage buyers. I expect the higher, 4.5% plus mortgage rates will impact growth to a degree in 2017. But since the builders are now providing smaller homes in the mix, the downside risk due to higher rates is somewhat limited. Unlike 2013 and 2014, when builders seemed to be in a competition for who could offer the biggest homes, builders are now offering more options which is helping total sales. If this trend of offering more affordable homes in the mix doesn’t continue in 2017, then we are at risk for negative or very little growth in this sector, even considering the low number of total new homes sale. Remember we had only 560K-570K in new home sales in 2016 with a long economic expansion, sales are still very low historically. For 2017, I predict 4%-7% growth, if the positive trend of builders offering smaller homes continues then we can have much more growth in sales in 2017.
From Census:
http://www.census.gov/construction/nrs/pdf/newressales.pdf

5. Housing Starts
In 2016, the trend of slow and steady growth in housing starts continued. Multifamily construction declined but we saw positive growth in single-family residences. Unlike most people, I believe the trend of slow and steady growth was not only warranted but smart on the builders part. We have experienced a long economic expansion but new home sales aren’t much higher than what we saw during the recessions of the past few decades. It must be frustrating for the analysts who expected housing starts to blow up to the 50-year average. As it stands we don’t have the demographics to support that type of growth. Instead, expect slow and steady growth in starts with single-family homes making up most of the growth.
From Calculated Risk:
http://www.calculatedriskblog.com/2016/12/housing-starts-decreased-to-1090.html

6. Economics
in 2016, I predicted 1.9%-2.3% growth in GDP and monthly job creation numbers falling to 190K-205K a year. Those predictions were largely realized in 2016, even if growth for Q4 ends up being higher than anticipated. JOLTS ( job openings) hit an all time high in 2016, with 5,900,000 openings and unemployment claims stayed below 300,000 the entire year. The labor market is getting tight. The Fed wage index is at a cycle high at 3.9% and over 4% for job switchers, so don’t expect 300K-400K job gains every month in 2017. In fact, for 2017 I am lowering my job creation numbers again ( 3rd straight year of decline) to adjust for tightening of the labor market leading to a lack of labor force growth. We are in the early stages of a shift in demographics, when a massive group of ages 21-26, will enter the prime age labor force. This should add some much-needed labor into the mix. However, look for job creation numbers monthly to come down to 140K-170K a month, to account for labor force growth. I am still in the 1.9%-2.3% GDP camp.
From Doug Short:
https://www.advisorperspectives.com/dshort/updates/2016/12/23/visualizing-gdp-an-inside-look-at-the-q3-third-estimate

7. Recession Watch
I recently joked on a Facebook live that once President Trump got in the office a lot of my fellow conservatives would change their bearish outlook on the American economy to a more sunny, bullish one before any new legislation even got passed. It was shocking (not!) that is exactly what has happened. As a prime example, Harry Dent took back his weekly claim of the Dow going to 6,000. I would like to suggest that we look a data rather than ideology to predict whether or not we should expect a recession.
For those who agree, here are some things to look for:
A.Is there over-investment in a key economic sector of the economy such as housing or the stock market? Over-investment is necessary in order to prime a recession. Unless you scale the heights you cannot take a great fall.
B. Are leading economic indicators falling for 4-6 months straight? A dip for one or two months does not a recession make. A sustained trend is needed to indicate a recession rather than a temporary correction.
C. Have unemployment claims gone over 323K on the 4-week moving average?
D. Has the Federal Reserve taken steps to fight inflation?
From Doug Short:
https://www.advisorperspectives.com/dshort/updates/2016/12/23/conference-board-leading-economic-index-flat-in-november

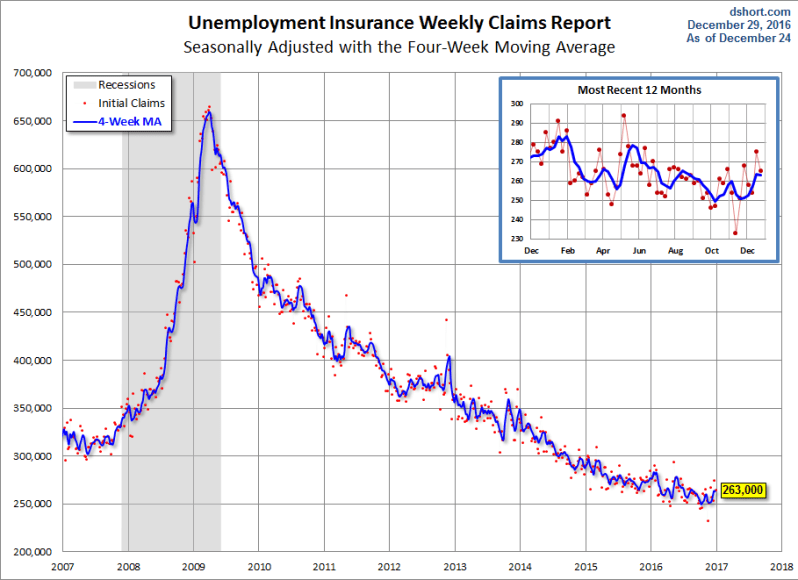
Since 2009 we haven’t seen any of the above indicators and unemployment claims has had a streak of 95 weeks under 300K. For 2017 we are safe. Oil prices have gone up from the lows of 2016, PMI numbers are looking better and world trade is picking up. The dollar is on the verge of making an epic break out. If it breaks over 106 – 108 then manufacturing will get hit again but for now, the dollar commodity relationship has calmed down from it’s an initial big impact in 2015.
Trump and the Economy
As I stated earlier, I believe that demographics and inflation have a greater effect on the economy than any sitting president. I am not concerned that Trump will cause rising mortgage rates and bond yields or start a trade war in 2017. President-elect Trump may make some deals to keep a few companies from moving jobs overseas, but to date, he hasn’t threatened tax penalties for those who already have factories in other countries. I go into more detail on the potential effects of the Trump presidency on manufacturing in a previous article and will not reiterate those points here.
https://loganmohtashami.com/2016/12/09/manufacturing-under-president-donald-trump/
Regarding infrastructure expenditures and tax reform, I expect both to be fully implemented in 2018. I expect President Trump and Congress to aggressively attack or dismantle the Affordable Healthcare Act, but have no expectation of an agreement for some other plan to take its place.
2017 should be an interesting year because there is a risk that both the U.S. dollar and the 10-year yield could go higher –leading to problems in manufacturing and housing. I would keep my eye out for those two variables. On the positive side, continued economic weakness in China, Japan, and Europe still will not have the dampening power to put the U.S. into recession as many have said over the last few years. This is America folks, not some 3rd world country with a devaluing currency leading to massive inflation.
Logan Mohtashami is a financial writer and blogger covering the U.S. economy with a specialization in the housing market. Logan Mohtashami is a senior loan officer at AMC Lending Group, which has been providing mortgage services for California residents since 1987. Logan also tracks all economic data daily on his own facebook page https://www.facebook.com/Logan.Mohtashami