

Overview of 2018
2018 is ending with one of the worst December stock market performances ever, falling oil prices, dropping bond yields, and cheers from the American bears anticipating their long-hoped-for recession. But with the close of 2018, we will see that our American bears are grievously disappointed once again; their doomsday expectations not realized. Instead, the U.S. is enjoying job openings at an all-time high, the longest job expansion ever recorded in history and soon the longest economic expansion in history. My big call for housing in 2018 was that sales would go negative and inventory would rise, but neither so much as to warrant a fuss.
For my predictions for 2018, I wrote:
“For 2018, I anticipate existing home sales to be in the range of 5.27 – 5.53 million units. If we end the year showing negative growth, with rising inventory once again, don’t worry, be happy. This would be “normal,” especially when purchase applications are still trying to party like it is 1999.”
https://loganmohtashami.com/2017/12/31/2018-economic-housing-predictions/
Housing inventory did rise, and despite promises to the contrary, this did not create a boom in existing home sales or new home sales. Home prices continued to grow, although the rate of growth slowed. A recent slow down in single-family construction suggests that expectations for new home sales growth are limited.
My other big call for 2018 was that yields would invert. I never budged from this thesis, and we finally did see yield inversion in 2/5’s and 3/5’s and a less than 10 basis point spread on the 2/10 yields. I believe that the inversions took some by surprise because many thought that long-end bond yields must go a lot higher. Despite the rocky end to 2018, it was a decent year in terms of U.S. economics, but there are changes in the wind as we blindly lurch forward into 2019.
Two issues that took seed in 2018 will remain important for determining economic conditions in 2019. First is the trade war. I am not afraid of a massive escalation in the trade war, but the markets are being affected by all the China talk, so until we get some clarity on this issue, it will remain a cloud in the sky. Also, we see some material impact from the trade war but nothing big enough to warrant a recession, yet. Second is the Fed. I have written a lot about the Fed rate hikes over the years.
https://loganmohtashami.com/2018/11/29/the-fed-still-needs-more-inflation-2018-edition/
While I think they have done an excellent job satisfying their dual mandate, they are pushing their limits on how much they can hike in this cycle when inflation expectations are falling.
Predictions for 2019
1. Mortgage Rates and the 10-Year Yield
For the past few years, I have stayed faithful to my call that the bond market ten-year yield will remain in the channel between 1.60 and 3%. I genuinely believe that the 10-year yield won’t break away from 3%. My prediction articles from previous years have said the same thing. In a podcast interview I gave earlier in the year I said that only if oil got to $87 would the 10-year go above 3% in the short-term. And this is what happened when oil got to $87, then the 10-year came back down again, like clockwork.
Inflation expectations have been falling, which will keep yields low. For 2019, I am sticking to my call that the 10-year yield will channel between 1.60% to 3%. If world trade gets weaker, we could see the 10-year yield with a 1% handle again. We may see a short-term breach of over 3% if a headline risk drives algorithm selling in the bond market – but still, this will be short-lived. We have a clear double top in the 10-year yield at 3.25%, so keep an eye out on that level. I really wouldn’t get too concerned about bond yields unless we breach above 3.47%. Mortgages rates should stay in the range of 4.125% – 4.875% range for most of the year. Anything above 5% or a 10-year above 3% should be short-lived. Inflation is low, and we don’t have forces out there that should change that for 2019. It would be a “Bigfoot event” to see core PCE and CPI inflation above 2.5% for any meaningful duration. If world trade really picks up, you may see the 10-year yield rise; however, the strong dollar and more oil production should keep this in check.
From Doug Short:
https://www.advisorperspectives.com/dshort/updates/2018/12/24/two-measures-of-inflation-and-fed-policy

2. Home Prices
Home prices still have legs to go higher in 2019, but the rate of growth is slowing. This is a good thing for the housing market. Inventory is rising but not fast enough to bring national home prices down. This cycle has demonstrated that you don’t need a strong demand for home prices to increase. Millions of people buy homes every year. In this cycle, housing tenure has doubled, which is facilitating the growth in home prices. For many years I have been stressing that the U.S.housing market doesn’t “naturally” support 6 months of inventory unless you have forced distress sales or a significant decline in demand. The areas that are at risk for price declines are those that saw the most significant price increases in this cycle like areas of California and Seattle. Even in these areas, I don’t anticipate dramatic drops because inventory levels are still low.
From Doug Short:
https://www.advisorperspectives.com/dshort/updates/2018/12/26/s-p-case-shiller-home-price-index-home-price-increases-slow


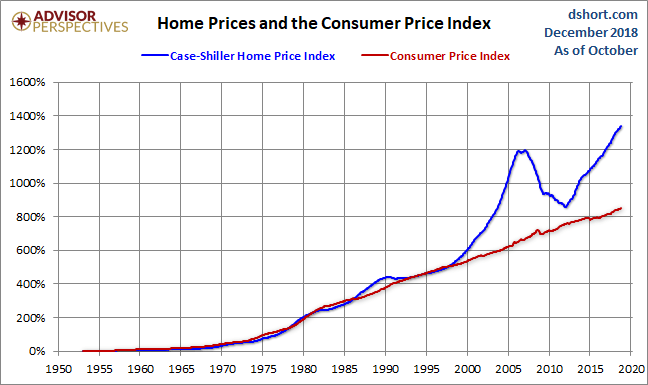
For those anticipating a housing bubble 2.0, I ask you to consider the difference between real home price gains from 2002-2005 vs. 2012-2018 as charted below. We don’t have the rapid adjusted to inflation price gains in this cycle like we did during the housing bubble years of 2002-2005. Since mortgage rates are lower in this cycle than the previous one, demand will be strong enough to prevent an epic collapse. Real home prices are high enough to impact demand when mortgage rates get 4.5% or higher, but we will not lose 1 million to 1.5 million existing home sales in a calendar year from mortgage buyers. The peak existing home sales print during the housing bubble was 7,260,000, which crashed down to below 4 million in 2008. We don’t have that booming mortgage demand in this cycle to warrant speculation buying that could lead to a collapse in national home prices in 2019.


3. Existing Home Sales
For 2018, I was looking for flat to negative sales trends and rising inventory. Nine of the 12 months this year had a negative year over year sales, which is slightly better than I expected. We will end the year with roughly 5,300,000 total existing home sales. Purchase application data was positive in almost every week in 2018 outside of 6 weeks. This might not be the case in 2019. We are at risk for a more negative year over year prints in the purchase applications data in 2019. Cash buyers are falling but not as fast as I thought they would. We may have to accept that we are going to have a higher percentage of cash buyers in the market for some time to come. We may not see the “traditional” 10% cash buyer metric again. Still, I am looking for a decline in cash buyers over last year – something like 16%-19% of total existing home sales. Because existing home sales fell in 2018, the bar for 2019 is a bit lower. I am looking for sales to trend flat to negative between 4.92- 5.29 million with slightly more inventory in 2019, but not a dramatic difference. This is the 3rd straight year I have looked for flat to negative sales trends for existing home sales. Unless we see a few months of over 6-months’ supply of inventory, I wouldn’t be concerned with some increases in the inventory numbers and negative sales growth. The existing home sales market is much different from the new home sale market. The real weakness for existing home sales in 2018 was in high heat price markets and from areas that saw falling cash buyers. Existing home sales have ranged from 4,900,000 to 5,510,000 since 2013. We always have 4 million mortgage buyers, 1 million cash buyers, and a variable of roughly 600,000 “cash & mortgage buyers” since 2013. Because of this, I don’t expect sales to break under 4,830,000 unless cash buyers fall more than expected.
From Doug Short:
https://www.advisorperspectives.com/dshort/updates/2018/12/19/existing-home-sales-up-again-in-november

4. New Home Sales
I find new home sales to be the most interesting economic sector for 2019. For 2018, I predicted the growth of 2%-5% in new home sales. Year to date numbers is showing about 2.8% growth (Last report not provided due to the government shutdown). However, towards the end of the year, we reached the 6.5 month supply with a negative year over year sales trend; These two things together create a huge red flag for future sales in my eye. We need to see supply get under 6.5 months and at least 4 to 6 months of sales above 640,000 with a confirmed revision to regain confidence in this sector. For the first time in this cycle, I am forecasting a negative sales trend for the coming year. I expect to see a negative 3% to 1% growth in new home sales in 2019. The builders could discount to add some more business. I expect they will instead hope that lower mortgage rates will get them back on track for slow and steady growth instead of decreasing their margins. The takeaway message for 2019 is that housing starts and new home sales will be soft unless sales can get back to 640,000, which can happen very quickly. Thankfully the builders did not heed the call to overbuild and saturate an already sleepy market.
From Doug Short:
https://www.advisorperspectives.com/dshort/updates/2018/11/28/new-home-sales-down-almost-9-in-october

5. Housing Starts
For 2018, single-family housing starts like new home sales have shown slow and steady growth. We also had an excellent rebound in multifamily starts. However, this all changed as demand started to get soft, and we saw a supply spike in the new home sales market.
From Fred:
https://fred.stlouisfed.org/series/MSACSR

For 2019, the rate of growth in single-family starts is at risk if new home sales don’t have a sales recovery toward that 640,000 sales trend. Typically, housing starts fall before a recession, so starts are one indicator to keep an eye on. Right now, housing is in the penalty box until we can get supply back below 6.5 months and sales trends to 640,000. Keep in mind that total housing starts are still low and we are a few years away from a much better demographic patch for housing. While that demographic patch might not create the mega boom in demand that some are hoping, it will provide replacement buyers to keep the market steady.
From Doug Short
https://www.advisorperspectives.com/dshort/updates/2018/12/19/secular-trends-in-residential-building-permits-and-housing-starts

6 Economics & Recession Watch
2018 was an outperforming year in many respects. Economic growth was better than I expected and job creation numbers were excellent, especially considering where we are in the economic cycle and the demographic constraints on our labor force. 2018 was the best job year I have ever seen in my life when one takes all the aspects of the job data together. We had a 7,300,000 job openings print, unemployment claims vs. civilian labor went to the lowest levels ever, and we have the longest job expansion ever at 98 months and counting. We are essentially getting toward full employment. The notion that millions of Americans have been sitting at home looking for work but unable to find any for 8, 16, 24, and even 36 years is ludicrous and borderline “Russian.” We are still producing twice as many jobs as population growth. However, if job openings reach 8-10 million and job creation numbers stay below 120K for any significant period, this could be a sign of a lack in productivity growth and scarcity of manual labor workers. However, we aren’t there yet, so let’s not speculate too much. The longer this expansion goes, the higher the likelihood we will see better productivity growth.
I look for six different indicators to signal an oncoming recession. We have seen three of these indicators already.
1. The Fed starts to hike rates (Easy one, the Fed hikes rate when the economy is on better footing)
2. The unemployment rate gets to gets to 4.9% in this cycle (Early stages of a tighter labor market)
3. Yields invert. (I know some will disagree with me on this)
—————————————————————————————————————————–
4. Housing starts to fall. This hasn’t happened yet.
5. We find that over-investment in the economic cycle that will create a big supply spike due to weaker demand, which will drag the entire economy lower. Some are concerned about the amount of corporate credit and leveraged loans in the marketplace, but these factors should not create a recession in 2019.
6. Leading economic indicators fall for 4 to 6 months straight. This hasn’t happened yet.
From Doug Short:
https://www.advisorperspectives.com/dshort/updates/2018/12/20/conference-board-leading-economic-index-pace-slowing-in-november

I expect GDP growth to slow to 2.3% to 2.6%. This type of growth is actually suitable at this stage of our economic history. I expect job creation numbers to fall but stay in the range of 137,000 – 157,000 per month. I expect car sales to decline year over year, but be mindful that we are working off the best 4-year period of car sales ever. I expect PMI data to fall year over year, which could impact domestic investment slightly, but the economic cycle still has legs to move forward. Keep an eye on the PMI data in 2019. Since America PMI data was good 2018, it has the most room to fall with falling oil prices now. Keep in mind that we already had a manufacturing recession when oil prices crashed a few years ago. We no longer have that massive over-investment in rigs ready to collapse like we saw before. We haven’t even recovered all the extraction jobs at the peak of the shale boom. We have a lot of noise in the economy right now. We have some legitimate concerns and some bright spots. As always, don’t let the ideologues convince you that American is about to collapse. I remain bullish on the long-term economic health of America and reject any and all extreme left and right nonsense, predicting our impending doom. Have a wonderful new year, everyone!
Final Note: This was my interview yesterday on Bloomberg Financial on the state of the housing market.

Logan Mohtashami is a financial writer and blogger covering the U.S. economy with a specialization in the housing market. Logan Mohtashami is a senior loan officer at AMC Lending Group, which has been providing mortgage services for California residents since 1987. Logan also tracks all economic data daily on his own facebook page https://www.facebook.com/Logan.Mohtashami