

In the last 24 hours, I have gotten a lot of questions about what was my model saying to me back then. First, I love this question; I wasn’t writing or being active on social media in the previous cycle, so for some readers, there is no way to know.
Unless you backtest the model. This is why it’s essential to have an economic model to talk about expansions and recession. This is a never-ending process as economics never sleeps. The model is more important than the person. Its a set of data lines that all work together. Some people can get obsessed with another person or a recession that they lose focus.
Recession, Obessesion, Depression, it’s not a healthy way to live. This is where discipline comes in, and the model keeps you in line always.
Right now, 3 of my recession flags are up.
1. The Fed Started the rate hike process
2. The unemployment rate gets down to a satisfied %, and for me, it was 4.9%
3. Yields inverted.
For me, my forecast at the end of 2017 was for yields to invert in 2018, and when it does, it will be the longest time before the first inversion to the recession. (December of 2018 inversion happened in my mind)
More on my recession model here as I want to really focus on the housing bubble years.
Recession Flag Watch Update
https://loganmohtashami.com/2019/10/15/recession-flag-watch-update/
Let’s take a look at 2006 because the market peaked on October 9th, 2007, and then the recession was on.
From Doug Short:
https://www.advisorperspectives.com/dshort/updates/2019/11/01/s-p-500-snapshot-another-record-high


Recession Red Flags That Are Left
Housing Starts typically fall into a recession. Find the overheated sector of the economy that creates a supply shock.
Not only was the over-investment in housing in the last cycle, but new home sales and housing starts started to decline in 2006 noticeably from a very bubble elevated level. Each cycle has its own unique sector that can create the recession, but the housing sector itself was raising red flags in 2006, and the data lines from 2002-2005 were showing the over investment.
2006 vs. Market peaking on October 9th, 2007 and first calender year recession in 2008


Leading economic indicators fall 4-6 months straight into a recession.
First, notice the cone shape activity in LEI in the last cycle. The Housing bubble boosted housing starts in such a powerful way that we didn’t have the up and down movement like we are having in this expansion. The cash out boom we saw in the housing bubble also allowed credit and spending to be facilitated as well. Professor Amir Sufi from Chicago Booth has some good work on this, we connected at a conference in Los Angeles in 2013, and that was a great conversation.
2006, yields inverted, housing starts, and new home sales were falling, and the rate of growth of LEI was decelerating consistently. That is key, tie the specific economic variables in the cycle together. Be the detective, not the troll.

When you see the consistent down curve trend in LEI, heads up people, especially after the 3 recession flags are raised.
1. Fed rate hike cycle starting
2. Low unemployment rate
3. Yield inversion
This is why you need to keep an eye out on leading economic indicators now more than any other time in this cycle.

Well, in early 2007, the leading economic data line was getting weaker. So well before October 9th, 2007, and the recession in 2008, this data line gave you a recession red flag as the others did as well in 2006.

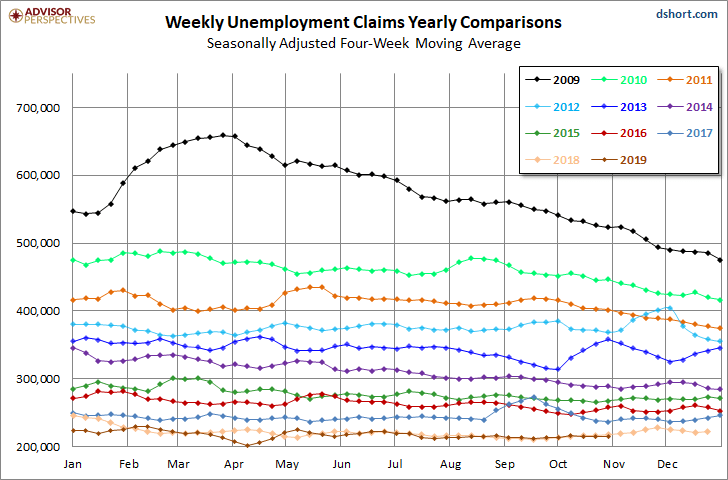
One thing to remember, jobless claims are forming a bottom in this cycle, we are historic lows vs. the civilian labor force. When the recession happens, this will take off for sure and have a breath. However, still forming a bottom isn’t that bad when you’re working from the lowest levels ever.
From Doug Short:
https://www.advisorperspectives.com/dshort/updates/2019/11/07/weekly-unemployment-claims-down-8k

Sectors to keep an eye out on now, Autos, and commercial real estate. Auto sales have had their best 5 year sales period ever with adjusting to inflation the best-looking consumer debt growth in this cycle. Commercial real estate prices have been hot in this cycle as well. We focus a lot of domestic PMI data, but so far we have had 11 sub 50 prints in ISM and no recession

Show discipline, don’t get recession obsession depression disease and don’t get obsessed about a specific individual, it’s not a healthy way to live.
Your model should be your voice, numbers should be your language handwriting and always look for flaws in your own work. Doubling and tripling down on a bad call just shows that you’re doing it more for marketing than actual economics.
One final note:
A fascinating economic throwdown event in Orange County this past week. Both the National Association Of Realtors and Chapman University are not forecasting a recession next year. As for myself, until all 6 flags are raised, I won’t say the R-word, and the process determines this rather than a date.
Have a wonderful weekend, everyone!
Youtube Link to the conference here. The presentation starts at the 20-minute mark:


Logan Mohtashami is a financial writer and blogger covering the U.S. economy with a specialization in the housing market. Logan Mohtashami is a senior loan officer at AMC Lending Group, which has been providing mortgage services for California residents since 1987. Logan also tracks all economic data daily on his own facebook page https://www.facebook.com/Logan.Mohtashami